Job Monitoring
With our web-based job monitoring system (ClusterCockpit), you can easily monitor and analyze the performance of your jobs on the Elysium HPC system. For a quick performance check, see Metrics to Check; for an in-depth analysis, refer to the HPC-Wiki. For details on the web interface, consult the official documentation.
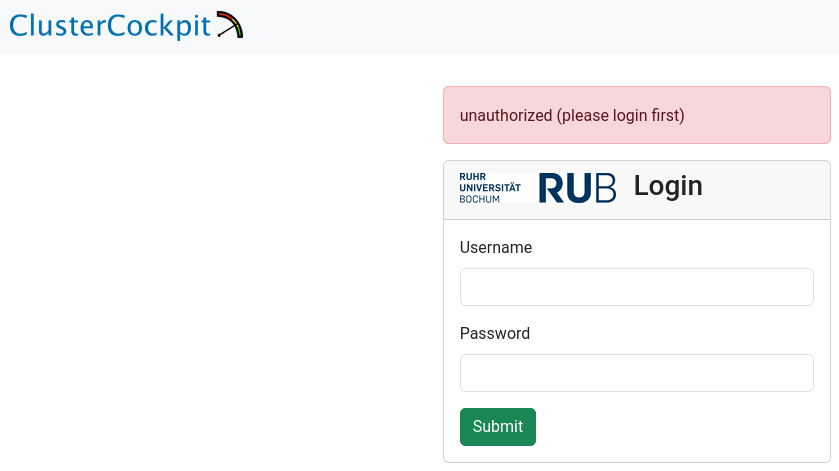
Login
To access the job monitoring system, use your RUB LoginID and corresponding password as credentials.
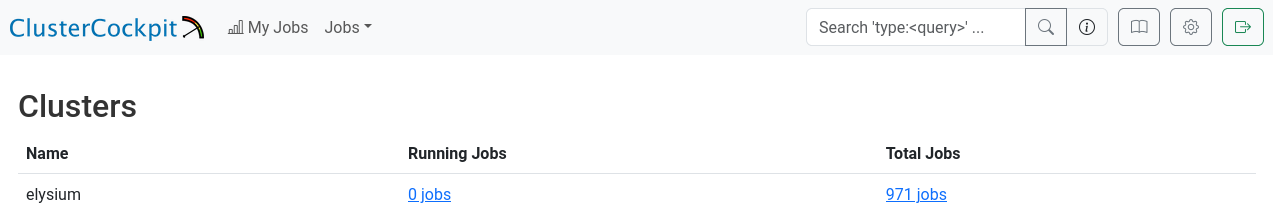
Overview
After logging in successfully, you will see the “Clusters” overview, which displays the total number of jobs you have run and the current number of jobs running on the cluster.
At present, this information includes only the Elysium cluster.
You can continue from here, either by going to the total jobs overview, or the running jobs overview.
Alternatively, you can click on “My Jobs” in the top left of the page, or search for job names/ids in the top right of the page.
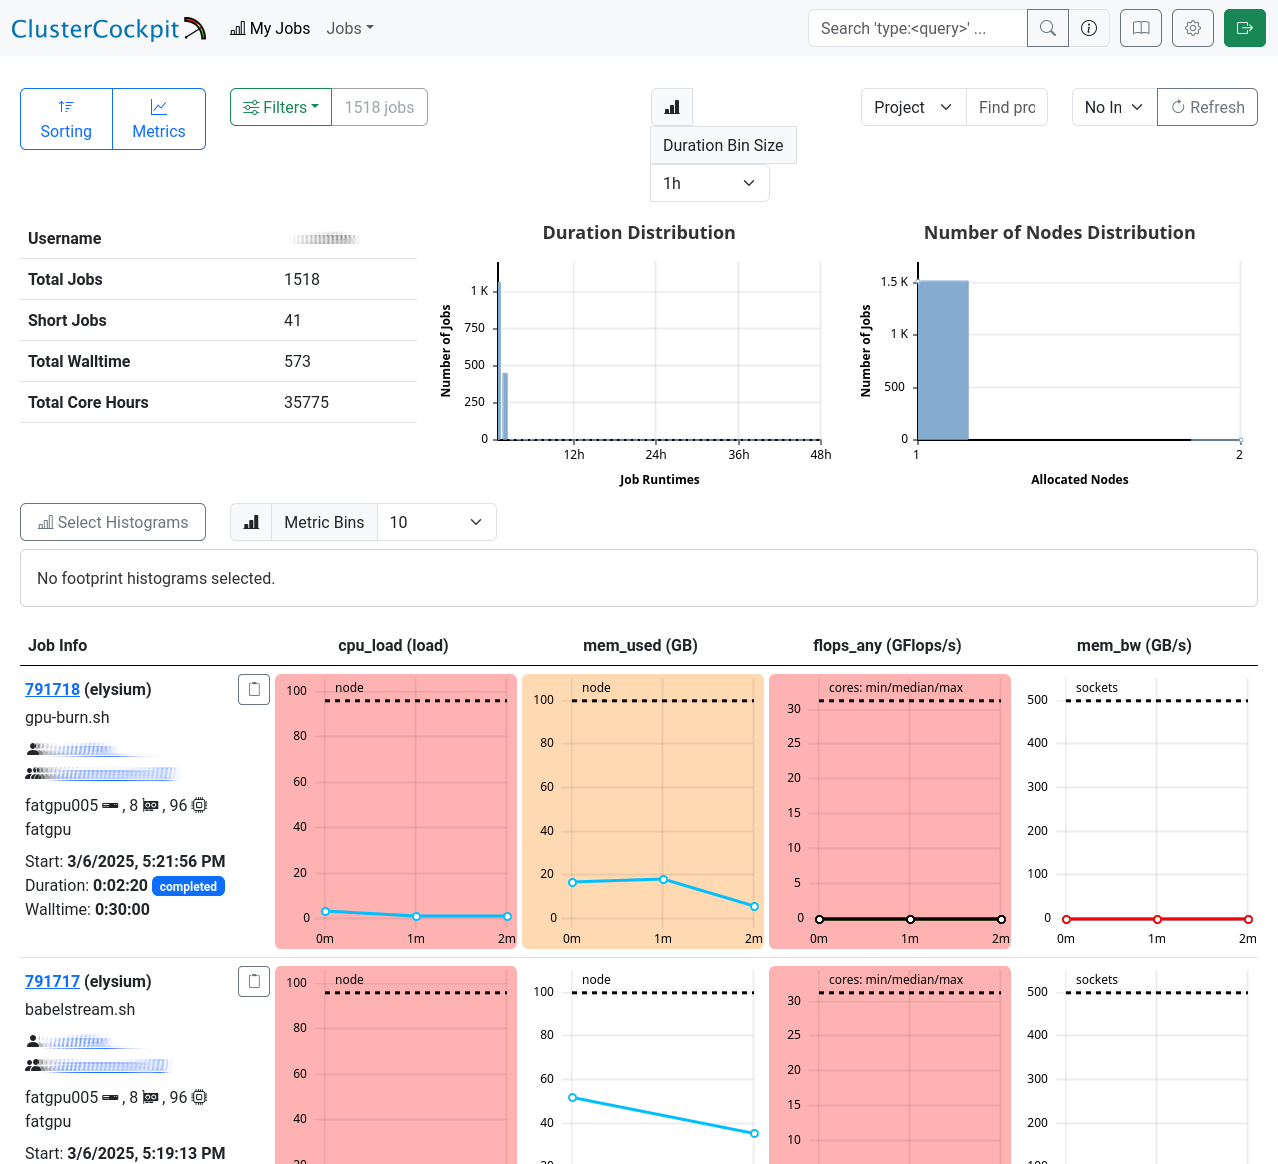
My Jobs
The “My Jobs” page displays a list of your jobs, fully customizable to your requirements. Use the menus in the top left corner to sort or filter the list, and select the metrics you want to display for your jobs. Below, you’ll find a detailed table with job IDs, names, and your selected metrics.
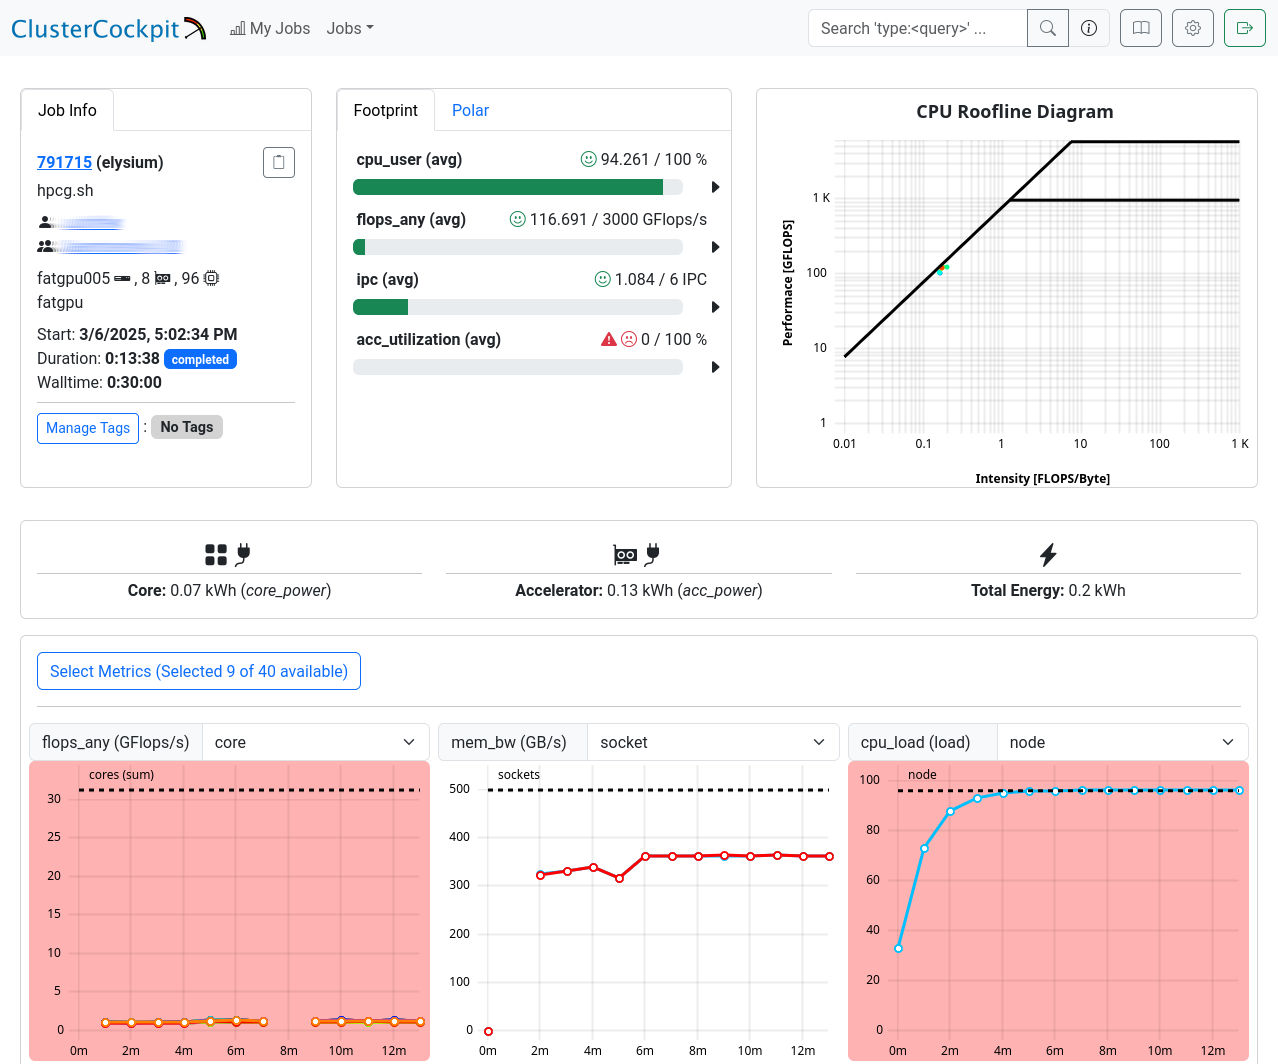
Job Details
This page is split into three sections. The first one shows general information: JobInfo, a footprint and a roofline diagram that shows how efficiently the job utilized the hardware. Note that the footprint is only updated every 10 minutes and the energy footprint is generated after the job finished.
In the next section some metrics are shown as diagrams. For some of the diagrams you can choose the scope, i.e. core, socket or node. The shown metrics and their order can be customized with the “Select Metrics” menu. This selection is saved per partition. Double-click the graph to zoom out if the scale is too small.
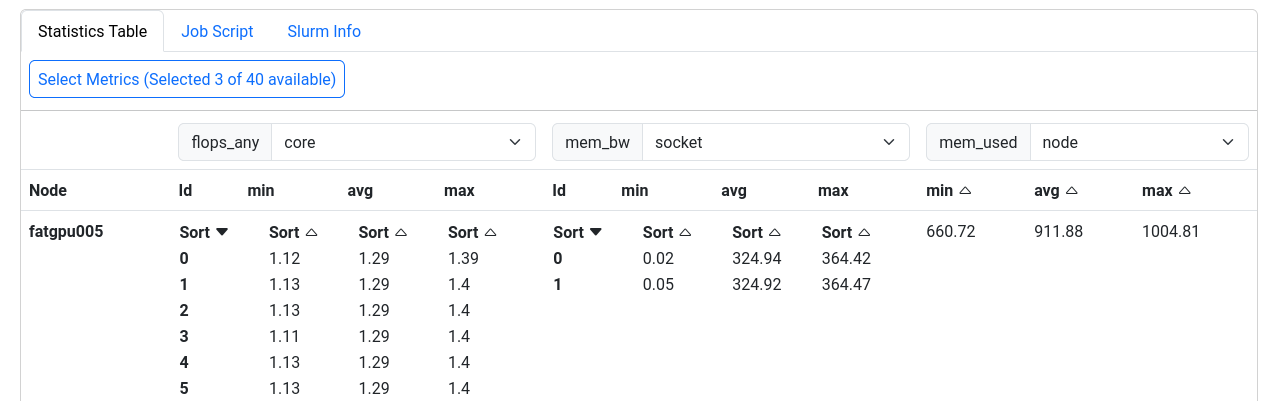
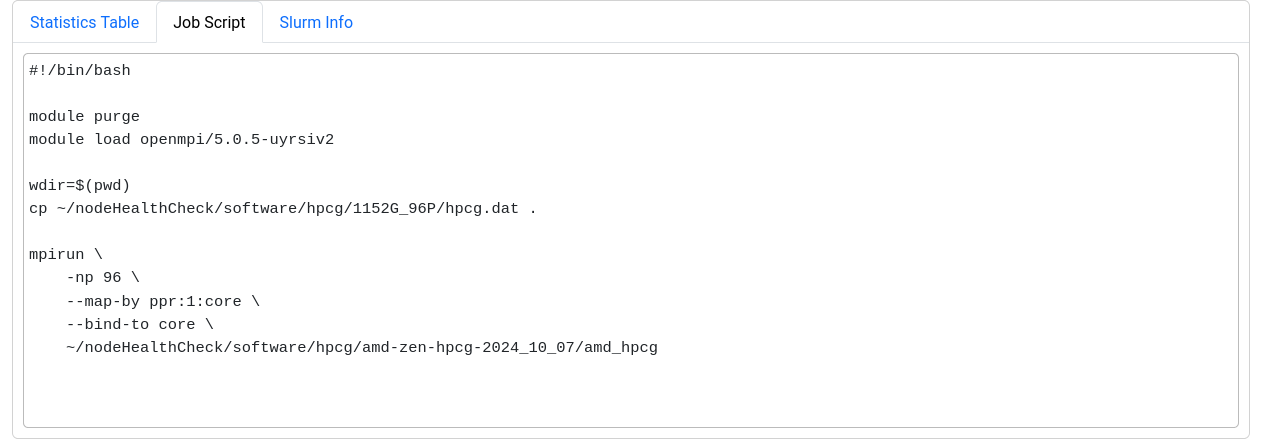
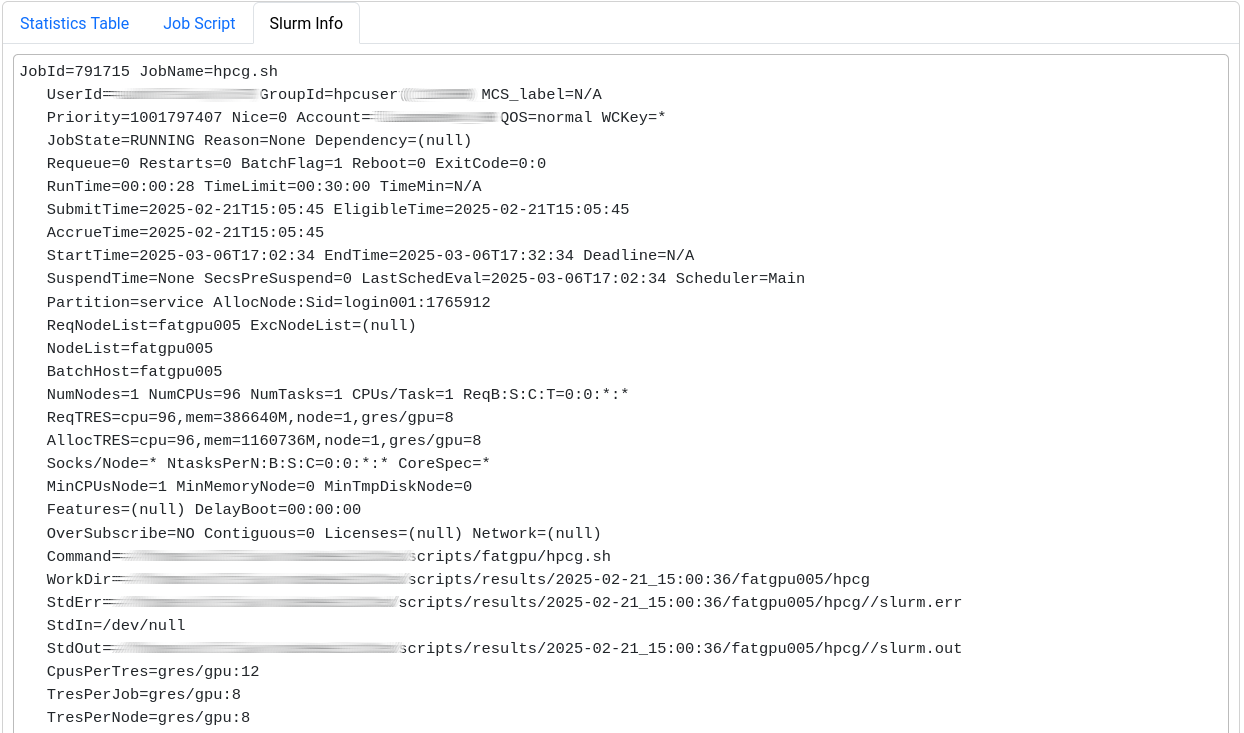
The last section displays selected metrics in a numerical way, lets you inspect your job script, and shows more detail about the job allocation an runtime parameters.
Metrics
The following table shows the metrics which are available for jobs on Elysium:
| Metric name | Meaning | Meaningful for shared jobs |
|---|---|---|
| CPU | ||
| cpu_load | Load on the node (processes/threads requesting CPU time) | No |
| cpu_load_core | Load on CPU cores of a job (processes/threads per core) | Yes |
| cpu_user | Percentage of CPU time spent as user time for each CPU core | Yes |
| clock | Frequency of the CPU cores of the job | Yes (affected by other jobs) |
| ipc | Instructions per cycle | Yes |
| flops_any | Floating-point operations performed by CPU cores | Yes |
| core_power | Power consumption of individual CPU cores | Yes |
| Memory | ||
| mem_bw | Memory bandwidth | No (full socket only) |
| mem_used | Main memory used on the node | No |
| disk_free | Free disk space on the node | No |
| GPU | ||
| nv_compute_processes | Number of processes using the GPU | Yes |
| acc_mem_used | Accelerator (GPU) memory usage | Yes |
| acc_mem_util | Accelerator (GPU) memory utilization | Yes |
| acc_power | Accelerator (GPU) power usage | Yes |
| acc_utilization | Accelerator (GPU) compute utilization | Yes |
| Filesystem | ||
| lustre_write_bw | /lustre write bandwidth | No |
| lustre_read_bw | /lustre read bandwidth | No |
| lustre_close | /lustre file close requests | No |
| lustre_open | /lustre file open requests | No |
| lustre_statfs | /lustre file stat requests | No |
| io_reads | Local Disk I/O read operations | No |
| io_writes | Local Disk I/O write operations | No |
| nfs4_close | /home + /cluster file close requests | No |
| nfs4_open | /home + /cluster file open requests | No |
| nfsio_nread | /home + /cluster I/O read bandwidth | No |
| nfsio_nwrite | /home + /cluster I/O write bandwidth | No |
| Network | ||
| ib_recv | Omnipath receive bandwidth | No |
| ib_xmit | Omnipath transmit bandwidth | No |
| ib_recv_pkts | Omnipath received packets/s | No |
| ib_xmit_pkts | Omnipath transmitted packets/s | No |
| net_bytes_in | Ethernet incoming bandwidth | No |
| net_bytes_out | Ethernet outgoing bandwidth | No |
| net_pkts_in | Ethernet incoming packets/s | No |
| net_pkts_out | Ethernet outgoing packets/s | No |
| NUMA Nodes | ||
| numastats_numa_hit | NUMA hits | No |
| numastats_numa_miss | NUMA misses | No |
| numastats_interleave_hit | NUMA interleave hits | No |
| numastats_local_node | NUMA local node accesses | No |
| numastats_numa_foreign | NUMA foreign node accesses | No |
| numastats_other_node | NUMA other node accesses | No |
| Node metrics | ||
| node_total_power | Power consumption of the whole node | No |
Metrics to Check
For a quick performance analysis, here are some key metrics to review:
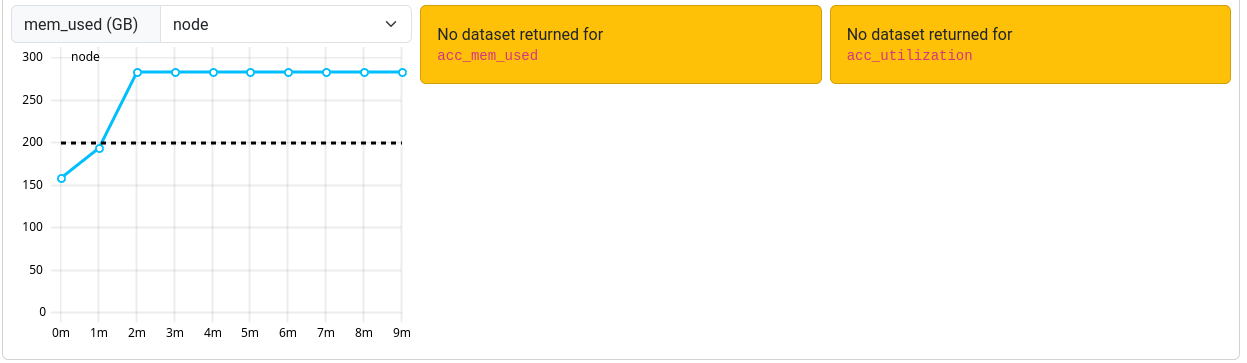
cpu_user: Should be close to 100%. Lower values indicate system processes are using some of your resources.flops_any: Measures calculations per second. On Elysium, a typical CPU node averages around 400 GFLOPS.cpu_load_core: Should be 1 at most for non-OpenMP jobs. Higher values suggest oversubscription.ipc: Instructions executed per cycle. Higher values indicate better efficiency.mem_bw: Memory bandwidth, maxing out at 350 GByte/s. Only meaningful if the node isn’t shared or your job uses a full socket.acc_utilization: GPU compute utilization. Aim for high percentages (e.g., above 80%) to ensure efficient GPU usage.
Known Problems
Occasionally, an orange box labeled “No dataset returned for <metric>” may be shown instead of the graph.
This occurs when the ClusterCockpit service was unable to collect the metrics during your job.
 Note that jobs that ran before March 12th 2025 may report missing or incorrect data in some cases.
The measurements for ipc and clock are sometimes too high. This is related to power saving features of the CPU. We are currently investigating how to solve this issue.
For jobs that ran before March 7th 2025 a bug triggered an overflow for the power usage metric resulting in unrealisticly high power consumptions.
This bug is fixed, but the fix cannot be applied to older jobs that were affected by it.
